We are ready to begin composing the classes needed to construct an editor that allows the operator to change profile properties, a dialog that incorporates the editor, and a feedback window that provides the operator with immediate visual feedback illustrating the effects of those changes. To see how this will work, run the application ShowProfileEditorFeedbackWindow from the project sandbox. The application displays the feedback window and allows you to change the grid unit and grid line spacing.
This page will examine the ProfileEditorFeedback class and the GraphManager class that supports it. We’ll begin by discussing the GraphManager class.
GitHub repository: Cartesian Plane Lesson 18
Previous lesson: Cartesian Plane Lesson 18 Page 7: ProfileFileManager JUnitTest
The GraphManager Class
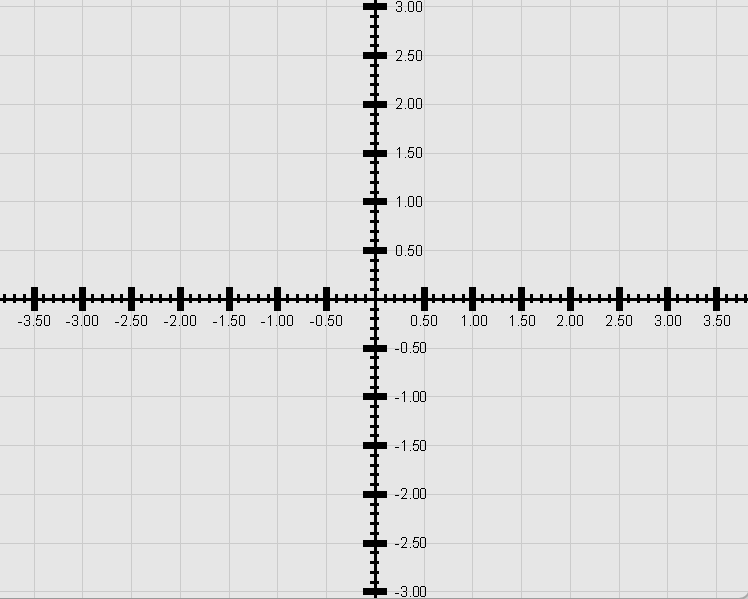
The figure at right shows the ProfileEditorFeedback window, which is virtually identical to the graphics window in the main CartesianPlane GUI. I started writing the ProfileEditorFeedback class by copying long code segments from the CartesianPlane class. As I copied more code, it became apparent that I was violating one of the most basic rules of good programming: eliminating duplicate code. The solution to the problem was to encapsulate the original code in a form that allowed it to be shared between the CartesianPlane and the ProfileEditorFeedback classes. The result is the GraphManager class.
Implementation Strategy
Instantiating the GraphManager requires the application to provide a Profile, a window to draw in, a rectangle delineating the drawing area within the window, and a graphics context with which to draw. The GraphManager can then draw any portion of the grid based on the properties stored in the Profile: the window background, the axes, grid lines, major and minor tic marks, and the labels on the axes.
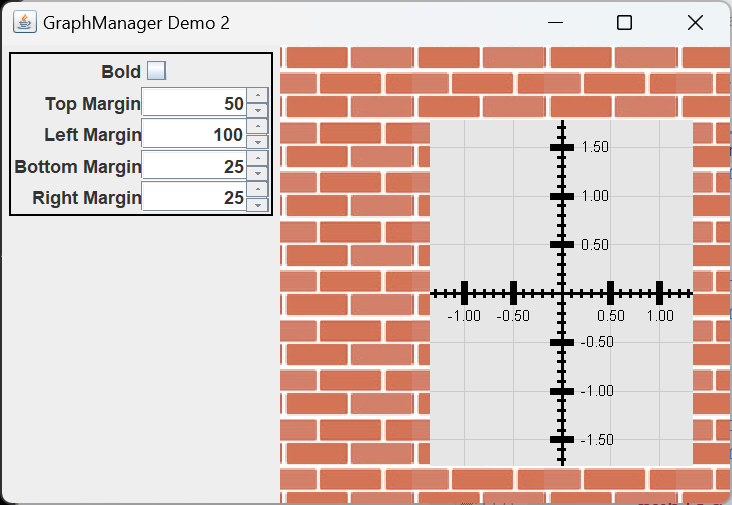
The application GraphManagerDemo2 in the project sandbox illustrates how this is accomplished. This application has a nested class, Canvas, a subclass of JPanel that incorporates a GraphManager. The demo allows you to control a few of the properties of the window containing the graph so you can make adjustments and immediately see the result in the application window. The following figure shows a partial listing for this class. The complete listing is in the GitHub repository.
1 2 3 4 5 6 7 8 9 10 11 12 13 14 15 16 17 18 19 20 21 22 23 24 25 26 27 28 29 30 31 32 33 34 35 36 37 38 39 40 41 42 | private static class Canvas extends JPanel { // ... private final Rectangle rect = new Rectangle(); public int leftMargin = 100; public int topMargin = 50; public int rightMargin = 25; public int bottomMargin = 25; private final GraphManager drawManager; private int width; private int height; private Graphics2D gtx; public Canvas( Profile profile ) { drawManager = new GraphManager( profile ); background = getBackgroundImage(); Dimension dim = new Dimension( 300, 500 ); setPreferredSize( dim ); } @Override public void paintComponent( Graphics graphics ) { width = getWidth(); height = getHeight(); gtx = (Graphics2D)graphics.create(); tile(); rect.x = leftMargin; rect.y = topMargin; rect.width = width - leftMargin - rightMargin; rect.height = height - topMargin - bottomMargin; drawManager.refresh( gtx, rect ); drawManager.drawAll(); gtx.dispose(); } // ... } |
In the above figure, the GraphManager (drawManager, line 10) is instantiated in the Canvas constructor (line 18). Each time the Canvas class’s paintComponent method is invoked, it configures the rectangle that defines the portion of the window that the graph is to occupy (lines 32-35), refreshes the GraphManager with a reconfigured rectangle and graphics context (line 36) and tells the GraphManager to redraw all the components of the graph (line 37)*.
*The paintComponent method of the Canvas class tiles its window with an image, something we haven’t encountered to this point. If you’re unhappy with this or don’t want to be bothered with it, replace the tile() invocation with: gtx.setColor( Color.WHITE ); gtx.fillRect( 0, 0, width, height );
If you wish only to redraw a portion of the graph, instead of drawAll you can use one or more of the methods:
- drawBackground()
- drawGridLines()
- drawAxes()
- drawMinorTics()
- drawMajorTics()
- drawText()
GraphManager Implementation
The details of the GraphManager implementation follow. We’ll start by discussing the infrastructure (class and instance variables, helper methods) and then move on to constructors and public methods.
⬛ GraphManager Class and Instance Variables
Find an annotated listing of the GraphManager’s class and instance variables below.
1 2 3 4 5 6 7 8 9 10 11 12 13 14 15 16 17 18 19 20 21 22 23 | public class GraphManager { private static final String axisPropertiesName = LinePropertySetAxes.class.getSimpleName(); private static final String ticMajorPropertiesName = LinePropertySetTicMajor.class.getSimpleName(); private static final String ticMinorPropertiesName = LinePropertySetTicMinor.class.getSimpleName(); private static final String gridLinesPropertiesName = LinePropertySetGridLines.class.getSimpleName(); private final Profile profile; private final GraphPropertySet mainWindow; private final LinePropertySet axis; private final LinePropertySet ticMajor; private final LinePropertySet ticMinor; private final LinePropertySet gridLine; private Rectangle2D rect; private float gridUnit; private Graphics2D gtx; // ... } |
- Lines 3-10: These are the simple names of the LinePropertySet concrete subclasses, declared here for convenience.
- Lines 12-17: The encapsulated Profile and the property set objects within the Profile. Initialized in the constructor.
- Line 19: The rectangle that determines the bounds within which the grid is to be drawn. Initialized in the constructor and updated every time the refresh(Graphics2D graphics, Rectangle2D) method is invoked.
- Line 20: The current value of the grid unit property. Initialized in the constructor from the encapsulated Profile and updated every time the refresh(Graphics2D) method is invoked.
- Line 21: The graphics context for drawing the grid. Updated every time the refresh(Graphics2D) is invoked.
⬛ GraphManager Private Methods
In this section, we’ll discuss the private methods of the GraphManager class.
🟦 private Stroke getStroke( float width )
This method creates, configures, and returns a Stroke object. Calling this method when a Stroke is needed guarantees that the Stroke is consistently configured. The caller passes the desired weight. We configure our line ends with a CAP_BUTT, which prevents lines of width greater than one from extending beyond their endpoints. We don’t care about joins, but the BasicStroke constructor requires us to configure one, so we arbitrarily chose JOIN_BEVEL (for more about configuring lines, see Styling Line Caps and Line Joins from the Wolfram Demonstration Project, Stroking and Filling Graphics Primitives in the Oracle Java Tutorial, and Java Graphics Tools on this website). Here’s the code.
private Stroke getStroke( float width )
{
    int     lineCap     = BasicStroke.CAP_BUTT;
    int     lineJoin    = BasicStroke.JOIN_BEVEL;
    Stroke  stroke      = new BasicStroke( width, lineCap, lineJoin );
    return stroke;
}
🟦 private void drawLines( LinePropertySet propSet )
This method draws the lines using the properties found in the given LinePropertySet. The annotated code follows.
1 2 3 4 5 6 7 8 9 10 11 12 13 14 15 16 17 18 19 20 21 22 23 | private void drawLines( LinePropertySet propSet ) { if ( propSet.getDraw() ) { float lpu = propSet.getSpacing(); float len = propSet.getLength(); Stroke stroke = getStroke( propSet.getStroke() ); Color color = propSet.getColor(); LineGenerator lineGen = new LineGenerator( rect, gridUnit, lpu, len, LineGenerator.BOTH ); gtx.setStroke( stroke ); gtx.setColor( color ); StreamSupport .stream( lineGen.spliterator(), false ) .forEach( gtx::draw ); } } |
- Line 3: Before drawing the lines, make sure that the draw value of the given LinePropertySet is true.
- Line 5: Get the line spacing (the lines per unit).
- Line 6: Get the line length (recall that for axes and grid lines, which don’t have a length, this value will be -1).
- Line 7: Get the line stroke and convert it to a Stroke object.
- Line 8: Get the line color.
- Lines 9-16: Instantiate a LineGenerator (see Encapsulating Line Drawing in Cartesian Plane Lesson 4: Tic Marks, Labels).
- Lines 17,18: Set the stroke and color in the graphics context.
- Lines 19-21: Draw the lines (see To Generate a Stream from an Iterable in Cartesian Plane Lesson 8: Streaming).
🟦 private void drawLabels( int orientation )
Draws the text on the major tic marks for either the x-axis or y-axis. The parameter orientation must be either LineGenerator.VERTICAL (for the tic marks on the x-axis, drawn vertically) or LineGenerator.HORIZONTAL (for the tic marks on the y-axis, drawn horizontally). Following is an annotated listing for this method.
Note: For a discussion of how to use the FontRenderContext and TextLayout classes, see The TextLayout Facility in Cartesian Plane Lesson 4: Tic Marks, Labels
1 2 3 4 5 6 7 8 9 10 11 12 13 14 15 16 17 18 19 20 21 22 23 24 25 26 27 28 29 30 31 32 33 34 35 36 37 38 39 40 41 42 43 44 45 46 47 48 49 50 51 52 53 54 55 56 57 58 59 | private void drawLabels( int orientation ) { int labelPadding = orientation == LineGenerator.HORIZONTAL ? 5 : 3; float ticMajorMPU = ticMajor.getSpacing(); float ticMajorLen = ticMajor.getLength(); String fontName = mainWindow.getFontName(); int fontSize = (int)mainWindow.getFontSize(); int fontStyle = mainWindow.getFontStyle(); Font labelFont = new Font( fontName, fontStyle, fontSize ); gtx.setFont( labelFont ); Color fontColor = mainWindow.getFGColor(); gtx.setColor( fontColor ); FontRenderContext frc = gtx.getFontRenderContext(); float originXco = (float)rect.getCenterX(); float originYco = (float)rect.getCenterY(); LineGenerator lineGen = new LineGenerator( rect, gridUnit, ticMajorMPU, ticMajorLen, orientation ); for ( Line2D line : lineGen ) { float xco2 = (float)line.getX2(); float yco1 = (float)line.getY1(); float yco2 = (float)line.getY2(); float delta = orientation == LineGenerator.HORIZONTAL ? (originYco - yco1) : (xco2 - originXco); float unit = delta / gridUnit; String label = String.format( "%3.2f", unit ); TextLayout layout = new TextLayout( label, labelFont, frc ); Rectangle2D bounds = layout.getBounds(); float xco = 0; float yco = 0; if ( orientation == LineGenerator.HORIZONTAL ) { float yOffset = (float)(bounds.getHeight() / 2); xco = xco2 + labelPadding; yco = yco1 + yOffset; } else { float yOffset = (float)(bounds.getHeight() + labelPadding); float xOffset = (float)(bounds.getWidth() / 2); xco = xco2 - xOffset; yco = yco2 + yOffset; } layout.draw( gtx, xco, yco ); } } |

- Lines 3,4: Determine the spacing between the text and the tic mark it is centered on: five pixels to the right of the horizontal and three pixels below the vertical tic marks.
- Lines 6,7: Get the length and spacing between major tic marks. We’ll need these to create a LineGenerator to calculate the coordinates of the major tic marks.
- Lines 8-13: Create a font from the main window’s font properties and set it in the graphics context.
- Lines 15,16: Set the font color in the graphics context.
- Line 18-20: Get the FontRenderContext from the graphics context and the origin coordinates. We’ll need these to calculate the position of the text drawn on the major tic marks.
- Lines 21-28: Get a LineGenerator to iteratively generate the coordinates of the major tic marks on the given axis.
- Lines 29-58: For every line produced by the LineGenerator:
- Line 31: Get the x-coordinate of the line. For vertical tic marks, the coordinates of both endpoints are the same. For horizontal tic marks, X2 is to the right of X1.
- Lines 32-33: Get the y-coordinates of the line.
- Lines 34,35: Calculate the distance from the origin to the tic mark. For vertical tic marks, this is the x-coordinate of the tic mark minus the x-coordinate of the origin. For horizontal tic marks, it’s the y-coordinate of the origin minus the y-coordinate of the tic mark.
- Line 36: Calculate the unit value of the tic mark; see Calculating the Unit Value of a Tic Mark from its Pixel Coordinates.
- Line 37: Convert the unit value to a string.
- Lines 38-40: Calculate the dimensions of the string.
- Lines 41-56: Calculate the x- and y-coordinates of the position at which to draw the string (see Drawing the Labels in Cartesian Plane Lesson 4: Tic Marks, Labels):
- Lines 43-48: For horizontal tic marks:
- Line 45: The text’s vertical offset is one-half the text’s height.
- Line 46: The x-coordinate is the x-coordinate of the line plus the label offset (line 3).
- Line 47: The y-coordinate is the y-coordinate of the line plus the vertical offset.
- Lines 49-56: For vertical tic marks:
- Lines 51,52: The text’s vertical offset is the text’s height plus the vertical padding.
- Line 53: The horizontal offset is one-half the width of the text.
- Line 54: The x-coordinate is the x-coordinate of the line minus the horizontal offset.
- Line 55: The y-coordinate is the y-coordinate of the line plus the vertical offset (lines 51,52).
- Line 57: Draw the string.
Calculating the Unit Value of a Tic Mark from its Pixel Coordinates
Note: distance values are calculated specifically to determine the sign of the unit value: Δx = tic-mark - origin
Δy = origin - tic-mark

Given:
x-axis: y=200
y-axis: x=300
grid-unit: 100
- Question: If a horizontal tic mark has a y-coordinate of 250 pixels, what should its unit value be?
- The distance from the origin to the mark is Δy = 200 – 250 = -50
- Unit value = Δy / grid-unit = -50 / 100 = -0.5
- Question: If a vertical tic mark has an x-coordinate of 450 pixels, what should its unit value be?
- The distance from the origin to the mark is Δx = 450 – 300 = 150
- Unit value = Δx / grid-unit = 150 / 100 = 1.5
⬛ GraphManager Constructors
The GraphManager has three constructors.
🟦 public GraphManager( Profile profile )
This constructor chains to GraphManager( Rectangle2D rect, Profile profile ): this( new Rectangle(), profile );
For the rect argument, it instantiates a Rectangle of 0 width and 0 height. The client will most likely replace the rectangle in a subsequent call to refresh(Graphics2D graphics, Rectangle2D)
🟦 public GraphManager( JComponent comp, Profile profile )
This constructor chains to GraphManager( Rectangle2D rect, Profile profile ): this( comp.getVisibleRect(), profile );
It calculates the rect argument from the dimensions of the given component.
🟦 public GraphManager( Rectangle2D rect, Profile profile )
This constructor establishes the given rectangle as determining the bounds of the drawing area and the given Profile as the encapsulated profile. It also initializes the references to the profile’s property objects (see GraphManager Class and Instance Variables). The rectangle is overridden with every invocation of refresh(Graphics2D graphics, Rectangle2D rect). The profile is never overridden but can be reloaded using the resetProfile() method. The listing for this constructor follows.
public GraphManager( Rectangle2D rect, Profile profile )
{
    this.rect = rect;
    this.profile = profile;
    mainWindow = profile.getMainWindow();
    axis = profile.getLinePropertySet( axisPropertiesName );
    ticMajor = profile.getLinePropertySet( ticMajorPropertiesName );
    ticMinor = profile.getLinePropertySet( ticMinorPropertiesName );
    gridLine = profile.getLinePropertySet( gridLinesPropertiesName );
}
⏹ GraphManager Public Methods
In this section, we’ll discuss the public methods of the GraphManager class.
🟦 public void refresh( Graphics2D graphics, Rectangle2D rect )
🟦 public void refresh( Graphics2D graphics )
The first method updates the rectangle that determines the grid’s bounds and then calls the second. The second updates the graphics context and obtains the grid unit from the profile. Then, it fills the rectangle with the current background color. Here’s the code.
public void refresh( Graphics2D graphics, Rectangle2D rect )
{
    this.rect = rect;
    refresh( graphics );
}
public void refresh( Graphics2D graphics )
{
    if ( gtx != null )
        gtx.dispose();
    gtx = (Graphics2D)graphics.create();
    gridUnit = profile.getGridUnit();

    Color   color       = profile.getMainWindow().getBGColor();
    gtx.setColor( color );
    gtx.fill( rect );
 }
🟦 public void resetProfile()
This method calls the encapsulated profile’s reset method, causing it to reload all property values from the property manager: profile.reset();
🟦 public void drawBackground()
This method fills the encapsulated rectangle with the background color: gtx.setColor( mainWindow.getBGColor() ); gtx.fill( rect );
🟦 public void drawAxes()
🟦 public void drawGridLines()
🟦 public void drawMinorTics()
🟦 public void drawMajorTics()
These methods display the axes, grid lines, minor tics, and major tics, respectively. The drawAxes method makes a LineGenerator and draws the two lines that it produces. The other methods call the drawLines helper method. Here’s the code.
public void drawAxes()
{
    gtx.setColor( axis.getColor() );
    gtx.setStroke( getStroke( axis.getStroke() ) );

    Iterator<Line2D>    iter    = LineGenerator.axesIterator( rect );
    gtx.draw( iter.next() );
    gtx.draw( iter.next() );
}

public void drawGridLines()
{
    drawLines( gridLine );
}

public void drawMinorTics()
{
    drawLines( ticMinor );
}

public void drawMajorTics()
{
    drawLines( ticMajor );
}
🟦 public void drawVerticalLabels()
🟦 public void drawHorizontalLabels()
🟦 public void drawText()
The drawVerticalLabels method draws the labels on the x-axis; drawHorizontalLabels draws the labels on the y-axis; drawText is a convenience method that invokes the other two. The code for these methods follows.
public void drawVerticalLabels()
{
    if ( mainWindow.isFontDraw() )
        drawLabels( LineGenerator.VERTICAL );
}

public void drawHorizontalLabels()
{
    if ( mainWindow.isFontDraw() )
        drawLabels( LineGenerator.HORIZONTAL );
}

public void drawText()
{
    drawHorizontalLabels();
    drawVerticalLabels();
}
🟦 public void drawAll()
This convenience method initiates drawing all parts of the grid. The code looks like this:
public void drawAll()
{
    drawBackground();
    drawGridLines();
    drawAxes();
    drawMinorTics();
    drawMajorTics();
    drawText();
}
Retrofitting CartesianPlane
Now that we have a GraphManager class, our next task is integrating it into the CartesianPlane class. I won’t try to list every change we made to complete this step of the process. Instead, we will discuss some more significant changes, most involving deleted code. Refer to the diff file CartesianPlane17 vs CartesianPlane18 and the comments below. Line numbers refer to the listing on the page’s left side, the version of CartesianPlane.java found in Cartesian Plane Lesson 17*.
*This diff was generated by Vim, a free and open-source text editor initially developed by Bram Molenaar.
- Lines 455-513: Directly incorporating all the grid properties is no longer necessary. The properties are encapsulated in the Profile class and, in this context, used by the GraphManager.
- Lines 539,540; 596-599: CartesianPlane is no longer responsible for font-related operations.
- Lines 628-641: All drawing operations have been moved to GraphManager.
- Lines 685-809: Responding to modified properties has been simplified.
- Lines 837-986: All this code is now the responsibility of GraphManager.
The ProfileEditorFeedback Class
This simple class uses GraphManager as a bridge between the ProfileEditor and its property display. I originally designed it as a nested class in ProfileEditor, but that class became complicated enough to justify making the feedback window a top-level class.
The ProfileEditorFeedback class has one instance variable, a reference to its encapsulated GraphManager: private final GraphManager drawManager;
The GraphManager reference is initialized in the constructor, which also attempts to size the window. The width is taken from the MW_WIDTH_PN property, and the height is calculated to be half the screen’s height. Here’s the code.
public ProfileEditorFeedback( Profile profile )
{
    drawManager = new GraphManager( this.getVisibleRect(), profile );

    Dimension   screenSize  =
        Toolkit.getDefaultToolkit().getScreenSize();
    float       targetWidth     =
        PropertyManager.INSTANCE.asFloat(CPConstants.MW_WIDTH_PN );
    int         targetHeight    = (int)(.5 * screenSize.height + .5);

    Dimension   canvasSize  =
        new Dimension( (int)targetWidth, targetHeight );
    setPreferredSize( canvasSize );
}
The only method in this class is paintComponent. This method does nothing more than refresh the GraphManager object and invoke its drawAll() method. It looks like this:
@Override
public void paintComponent( Graphics graphics )
{
    super.paintComponent( graphics );

    Graphics2D  gtx = (Graphics2D)graphics;
    drawManager.refresh( gtx, this.getVisibleRect() );
    drawManager.drawAll();
}
Summary
On this page, we developed the GraphManager class. An object of this class can perform all the tasks necessary to draw the grid, tasks that were formerly the responsibility of the CartesianPlane class. Then, we developed the ProfileEditorFeedback class, which will use the GraphManager to display in real-time changes to grid properties made by the ProfileEditor (see The ProfiledEditor Class). We need to develop unit tests for these classes, which is a big deal. First, we’ll examine some concepts and facilities to assist our testing efforts. Our next topic will be optical character recognition (OCR), which we will use to verify that we are drawing labels correctly. Then, we’ll develop the LineSegment class, which will help us verify that lines are being drawn in the correct position and to the correct length, width, and color.