In the paragraphs below, we will develop the LineGenerator class. An instance of this class will be responsible for calculating the coordinates for drawing gridlines, axes, tick marks, and labels. The coordinates that it generates will be in pixels. But to calculate pixel coordinates, it will have to account for the type of line we wish to draw, the number of pixels per unit, and the number of lines per unit.
GitHub repository: Cartesian Plane Part 4
Previous page: Cartesian Plane Lesson 4 Page 1: Iterators and Iterables
See Nested Classes in the Oracle Java Tutorial for more information about inner classes.
Encapsulating Line Drawing
Our next task is to encapsulate line drawing in our Cartesian plane project. Why encapsulate line drawing? For one thing, it applies to many different pieces of our drawing logic:
- Drawing the grid lines.
- Drawing the axes.
- Drawing the minor tic marks.
- Drawing the major tic marks.
- Even label positioning can benefit from a line-drawing facility; for example, we can generate the positions of the major tic marks on the y-axis and then position the labels to their right.

(Other reasons: it’s a great exercise in encapsulation and writing iterators, iterables, and inner classes.)
The LineGenerator Class
Let’s create a separate class to calculate the coordinates of the grid’s horizontal and vertical lines. It will implement Iterable<Line2D> and can iterate over horizontal lines, vertical lines, or both. The following sections will describe the class and instance variables, helper methods, and public methods for our class.
⏹ Class and Instance Variables
The client uses the following constant variables to indicate which lines to iterate over: horizontal, vertical, or both. Note that the HORIZONTAL value maps to the 1-bit of an integer location, the VERTICAL value maps to the 2-bit, and BOTH is the bitwise or of HORIZONTAL and VERTICAL.
Note: This is a common method that allows the programmer to combine related, non-mutually exclusive values. For example, a font can be bold, italic, or both. In the Font class, the constant BOLD has a value of 1, and ITALIC has a value of 2. Now, a single integer value of 1 means bold, not italic; an integer value of 2 means italic, not bold; and a value of 3 (Font.BOLD | Font.ITALIC) means bold and italic. Values are combined, tested, and manipulated using Java bitwise operators, primarily bitwise or (|), bitwise and (&), and bitwise exclusive or (^). For a discussion of Java’s bitwise operators, see Bitwise and Bit Shift Operators in the Oracle Java tutorial, and What is a Bitwise Operator? on the W3 Schools website.
To determine if the user wants us to generate horizontal lines, we can ask: if ( (orientation & HORIZONTAL) != 0 )
iterate the horizontal lines
1 2 3 4 5 6 | public class LineGenerator implements Iterable<Line2D> { public static final int HORIZONTAL = 1; public static final int VERTICAL = 2; public static final int BOTH = HORIZONTAL | VERTICAL; // ... |
∎ Instance Variables
For a LineGenerator instance’s state, we’ll need to keep track of several grid properties, including the bounding rectangle and line spacing. We also need the length of a line and the total number of horizontal and vertical lines to draw. Here is an annotated listing of the state variable declarations.
1 2 3 4 5 6 7 8 9 10 11 12 13 14 15 16 17 18 19 | public class LineGenerator implements Iterable<Line2D> { // ... private final Rectangle2D gridRect; private final float horLength; private final float vertLength; private final int orientation; private final List<Line2D> axes = new LinkedList<>(); private final List<Line2D> horLines = new LinkedList<>(); private final List<Line2D> vertLines = new LinkedList<>(); private final float spacing; private final float originXco; private final float originYco; private final float leftLine; private final float rightLine; private final float topLine; private final float bottomLine; // ... } |
- Line 4: The rectangle within which the grid is to be drawn.
- Lines 5,6: Horizontal and vertical line lengths. For tick marks, these will have the same value. For grid lines and axes, the horizontal length will be the width of the bounding rectangle, and the vertical length will be the height. We configure them in the CartesianPlane constructor.
- Line 7: The orientation supplied to the constructor, HORIZONTAL, VERTICAL, or BOTH.
- Lines 8-10: Lists containing the coordinates of the lines generated by the LineGenerator facility; they are all configured in the constructor. The facility generates all possible lines each time a client instantiates LineGenerator.
- Line 8: A list containing the coordinates of the axes.
- Line 9: A list containing the coordinates of the horizontal lines.
- Line 10: A list containing the coordinates of the vertical lines.
- Line 11: The spacing between lines; it is set in the constructor from gpu / lpu.
- Lines 12,13: The coordinates of the grid’s origin.
- Lines 14-17: The coordinates of the lines that we will draw closest to the grid’s bounding rectangle:
- Line 14: The x-coordinate of the leftmost line to calculate; this will always be greater than the x-coordinate of the rectangle.
- Line 15: The x-coordinate of the rightmost line to calculate; this will always be less than the x-coordinate of the rectangle’s right boundary
- Line 16: The y-coordinate of the topmost line to calculate; this will always be greater than the y-coordinate of the rectangle.
- Line 17: The y-coordinate of the bottom-most line to calculate; this will always be Less than the y-coordinate of the rectangle’s lower bound.
Digression: Testing Floating Point Values for Equality
As you may know, testing floating point values for equality can be tricky because of rounding errors. If you are unaware of that, try running this bit of code:
public class RoundingErrorDemo
{
    public static void main(String[] args)
    {
        double  dVar1   = .7 + .1;
        double  dVar2   = .9 - .1;
        System.out.println( dVar1 == dVar2 );
    }
}
To circumvent this problem, we can use the epsilon test for equality (sometimes called the delta test for equality). Choose a very small value for epsilon, say .00001. Now, take the difference between the two values; if the difference is less than epsilon we can treat the two values as though they were equal. Here’s a helper method to illustrate the technique:
private static boolean equal( float fVal1, float fVal2 )
{
    final float epsilon = .0001f;
    float       diff    = Math.abs( fVal1 - fVal2 );
    boolean     equal   = diff  < epsilon;
    return equal;
}
Note: If you’re a devotee of numerical analysis, you may object to calling this method “equal.” If so, feel free to rename it “closeEnoughForJazz.”
⏹ Private Methods
There are three private methods in LineGenerator that compute the grid’s axes (axial lines) and its non-axial lines (the horizontal and vertical lines that are not the x- or y-axis). A fourth, equals(double, double), is a helper method to compare two floating-point values using the epsilon test for equality:
private static boolean equals( double dNum1, double dNum2 )
{
    final double    epsilon = .00001;
    double          diff    = Math.abs( dNum1 - dNum2 );
    boolean         result  = diff < epsilon;
    return result;
}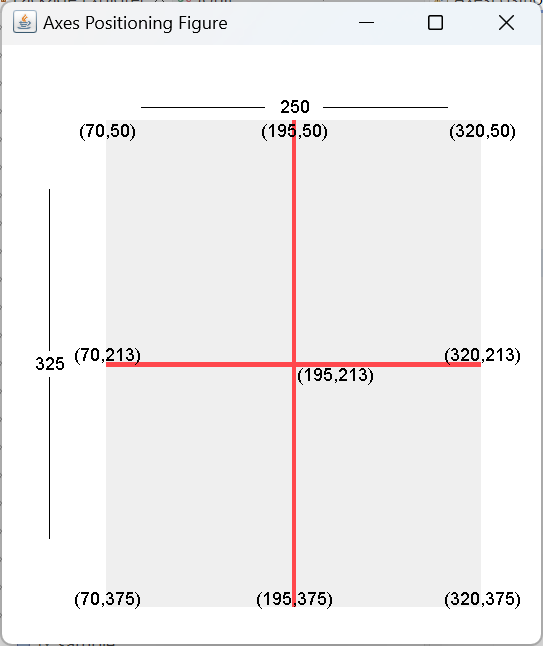
The x-axis is a horizontal line positioned at the vertical center of the bounding rectangle; the y-axis is the vertical line at the horizontal center of the rectangle. If a bounding rectangle has an upper-left corner of (x=70,y=150), a width of 250, and a height of 325, the coordinates of the x-axis will be:
- x1 = x = 70
- y1 = y + height / 2 = 213
- x2 = x1 + width = 320
- y2 = y1 = 213
and the coordinates of the y-axis will be:
- x1 = x + width / 2 = 195
- y1 = y = 50
- x2 = x1 = 195
- y2 = y1 + height = 375
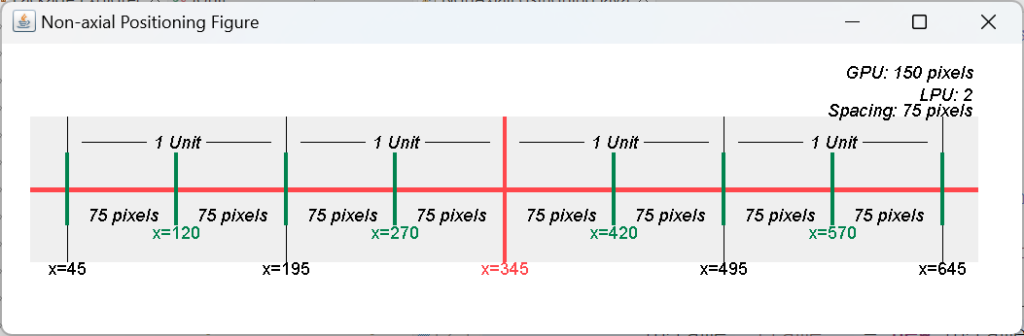
The generated non-axial lines never include x = 0 or y = 0, or any line coincident with the rectangle’s border. We compute the line spacing from the grid unit (GPU) and the lines per unit (LPU); if the GPU is 100 and the LPU is 2, there will be 50 pixels between lines. We calculate the positions of the vertical lines beginning at the left of the rectangle, and the positions of the horizontal lines starting at the top of the rectangle.
∎ private void computeAxes()
∎ private void computeVerticals()
∎ private void computeHorizontals()
We use these three methods to generate lines within the grid’s bounding rectangle. The method computeAxes generates the x- and y-axes and stores them in the list referenced by the axes instance variable. It looks like this:
private void computeAxes()
{
    Point2D hPoint1 = new Point2D.Double( leftLimit, originYco );
    Point2D hPoint2 = new Point2D.Double( rightLimit, originYco );
    Point2D vPoint1 = new Point2D.Double( originXco, topLimit );
    Point2D vPoint2 = new Point2D.Double( originXco, bottomLimit );
    axes.add( new Line2D.Double( hPoint1, hPoint2 ) );
    axes.add( new Line2D.Double( vPoint1, vPoint2 ) );
}
The computeVerticals method generates the non-axial vertical lines. It starts with the leftmost vertical line, previously calculated in the constructor, and proceeds to the right, skipping the line x=0. The annotated code follows; see also Instance Variables above.
1 2 3 4 5 6 7 8 9 10 11 12 13 14 15 16 | private void computeVerticals() { float yco1 = originYco - vertLength / 2; float yco2 = originYco + vertLength / 2; for ( float xco = leftLine ; xco <= rightLine ; xco += spacing ) { // Do not add y-axis to list of vertical lines if ( !equals( xco, originXco ) ) { Point2D top = new Point2D.Double( xco, yco1 ); Point2D bottom = new Point2D.Double( xco, yco2 ); Line2D line = new Line2D.Double( top, bottom ); vertLines.add( line ); } } } |
- Lines 3, 4: Compute the y-coordinate of the endpoints of a vertical line. If we’re formulating a gridline, yco1 and yco2 will correspond to the top and bottom bounds of the enclosing rectangle. If we’re formulating a tick mark with length 20, yco1 will lie ten pixels above the x-axis, and yco2 will lie 10 pixels below the x-axis.
- Line 5: Sequentially generate the x-coordinates of the vertical lines, from the leftmost to the rightmost.
- Line 8: Prevents us from drawing a vertical line on the y-axis.
- Lines 10, 11: Formulate the endpoints of the target vertical line.
- Lines 12, 13: Instantiate the target vertical line and add it to the list of vertical lines.
The computeHorizontals method is very similar to computeVerticals. It generates lines from the top to the bottom of the enclosing rectangle and adds them to the list of horizontal lines. The code is in the GitHub repository.
Exercise: Complete the computeHorizontal method before looking at the solution in the GitHub repository.
⏹ Constructors and Public Methods
Our primary constructor will establish the values of all our instance variables and generate all the lines; see also Instance Variables above. Here’s an annotated listing of this constructor.
1 2 3 4 5 6 7 8 9 10 11 12 13 14 15 16 17 18 19 20 21 22 23 24 25 26 27 28 29 30 31 32 33 34 35 36 37 38 39 | public LineGenerator( Rectangle2D rect, float gridUnit, float lpu, float length, int orientation ) { this.gridRect = rect; this.spacing = gridUnit / lpu; this.horLength = length != -1 ? length : (float)rect.getWidth(); this.vertLength = length != -1 ? length : (float)rect.getHeight(); this.orientation = orientation; originXco = (float)rect.getCenterX(); originYco = (float)rect.getCenterY(); double halfWidth = rect.getWidth() / 2; int halfHor = (int)(halfWidth / spacing); // Make sure the left and right borders are excluded from the count. if ( equals( halfHor * spacing, halfWidth ) ) --halfHor; leftLine = (float)(originXco - halfHor * spacing); rightLine = (float)(originXco + halfHor * spacing); double halfHeight = rect.getHeight() / 2; int halfVert = (int)(halfHeight / spacing); // Make sure the left and right borders are excluded from the count. if ( equals( halfVert * spacing, halfHeight ) ) -- halfVert; topLine = (float)(originYco - halfVert * spacing); bottomLine = (float)(originYco + halfVert * spacing); computeHorizontals(); computeVerticals(); computeAxes(); } |
- Line 2: The bounding rectangle for the grid.
- Line 3: The pixels-per-unit (grid unit).
- Line 4: The lines per unit.
- Line 5: The length of a line. If this value is -1, the LineGenerator constructor will set the line length to the rectangle’s width for horizontal lines and its height for vertical lines.
- Line 6: The orientation, HORIZONTAL, VERTICAL, or BOTH.
- Lines 9: Initialize the gridRect instance variable.
- Line 10: Calculate the spacing between lines.
- Lines 11, 12: Adjust the line length, if necessary.
- Line 13: Initialize the orientation instance variable.
- Lines 15, 16: Determine the x- and y-coordinates of the origin.
- Lines 18, 19: Estimate the number of lines we need to draw in the left and right halves of the containing rectangle.
- Lines 21, 22: If the estimated number of lines is equal to half the width of the rectangle, our estimated count will include lines to be drawn over the left- and right-borders of the rectangle, so the final count will be one less than the estimated count.
- Lines 24, 25: Calculate the x-coordinates of the leftmost and rightmost lines.
- Lines 27-34: Similar to lines 18-25, but determines the y-coordinates of the topmost and bottom-most horizontal lines.
- Lines 36-38: Populate the lists containing the horizontal and vertical lines and the axes.
The remaining constructors allow the line length and/or orientation to default. As we did with the CartesianPlane constructors, we’ll use chaining for the constructor implementations. Here are our additional constructors.
1 2 3 4 5 6 7 8 9 10 11 12 13 14 15 | public LineGenerator( Rectangle2D rect, float gridUnit, float lpu ) { this( rect, gridUnit, lpu, -1, BOTH ); } public LineGenerator( Rectangle2D rect, float gridUnit, float lpu, float length ) { this( rect, gridUnit, lpu, length, BOTH ); } |
∎ public float getHorLineCount()
∎ public float getVertLineCount()
In addition to the iterator method required by the Iterable interface, we’ll have getters for the vertical and horizontal line counts. (These are primarily for support of the label drawing logic.)
1 2 3 4 5 6 7 8 9 | public float getHorLineCount() { return horLines.size(); } public float getVertLineCont() { return vertLines.size(); } |
∎ public Iterator<Line2D> iterator()
∎ public Iterator axesIterator()
Our class declaration, public class LineGenerator implements Iterable<Line2D>, requires us to implement the iterator method. It takes a straightforward approach to generating an iterator. Depending on the orientation, it creates a list of vertical and/or horizontal lines and returns an iterator over them. The axesIterator method will generate an iterator for the x- and y-axes. The methods look like this:
@Override
public Iterator<Line2D> iterator()
{
    List<Line2D>    allLines    = new ArrayList<>();
    if ( (orientation & HORIZONTAL) != 0 )
        allLines.addAll( horLines );
    if ( (orientation & VERTICAL) != 0 )
        allLines.addAll( vertLines );

    Iterator<Line2D>    iter    = allLines.iterator();
    return iter;
}
public Iterator<Line2D> axesIterator()
{
    return axes.iterator();
}
∎ public static Iterator axesIterator( Rectangle2D rect )
Finally, for the user’s convenience, we have a class method that returns an iterator for the axes of a given bounding rectangle. As mentioned, we can get an axes iterator from any LineGenerator object. However, in some contexts, this code: Iterator axes = LineGenerator.axesIterator( gridRect );
might appear more logical than this code: LineGenerator lineGen = new LineGenerator( gridRect, gridUnit, gridLineLPU );
Iterator axes = lineGen.axesIterator();
A listing of this method follows.
public static Iterator<Line2D> axesIterator( Rectangle2D rect )
{
    LineGenerator       lineGen = new LineGenerator( rect, 1, 1, -1 );
    Iterator<Line2D>    iter    = lineGen.axesIterator();
    return iter;
}
Incorporating LineGenerator into CartesianPlane
The first thing we can do in CartesianPlane is revise our instance variable declarations. We no longer need the grid width/height variables or the min-/max-/center coordinates. We do, however, need a rectangle that encapsulates those properties. We also need to add instance variables for a Font and FontRenderContext to assist in rendering the labels (we’ll discuss these below). That section of the CartesianPlane class declaration now looks like this:
1 2 3 4 5 6 7 8 9 10 11 12 | /////////////////////////////////////////////////////// // // The following values are recalculated every time // paintComponent is invoked. // /////////////////////////////////////////////////////// private int currWidth; private int currHeight; private Graphics2D gtx; private Rectangle2D gridRect; private Font labelFont; private FontRenderContext labelFRC; |
Next, we can rewrite the logic to draw the grid lines and axes. I have listed the new code below. Note that I have taken the liberty of renaming drawGrid todrawGridLines. Also, in drawGridLines, I have added logic to draw grid lines conditionally based on the value of the gridLineDraw property.
1 2 3 4 5 6 7 8 9 10 11 12 13 14 15 16 17 18 19 20 21 22 23 | private void drawAxes() { gtx.setColor( axisColor ); gtx.setStroke( new BasicStroke( axisWeight ) ); Iterator<Line2D> axes = LineGenerator.axesIterator( gridRect ); gtx.draw( axes.next() ); gtx.draw( axes.next() ); } private void drawGridLines() { if ( gridLineDraw ) { LineGenerator lineGen = new LineGenerator( gridRect, gridUnit, gridLineLPU ); gtx.setStroke( new BasicStroke( gridLineWeight ) ); gtx.setColor( gridLineColor ); for ( Line2D line : lineGen ) gtx.draw( line ); } } |
Now that we have LineGenerator, adding the logic to draw the tick marks is straightforward.
1 2 3 4 5 6 7 8 9 10 11 12 13 14 15 16 17 18 19 20 21 22 23 24 25 26 27 28 29 30 31 32 33 34 35 36 37 | private void drawMinorTics() { if ( ticMinorDraw ) { LineGenerator lineGen = new LineGenerator( gridRect, gridUnit, ticMinorMPU, ticMinorLen, LineGenerator.BOTH ); gtx.setStroke( new BasicStroke( ticMinorWeight ) ); gtx.setColor( ticMinorColor ); for ( Line2D line : lineGen ) gtx.draw( line ); } } private void drawMajorTics() { if ( ticMajorDraw ) { LineGenerator lineGen = new LineGenerator( gridRect, gridUnit, ticMajorMPU, ticMajorLen, LineGenerator.BOTH ); gtx.setStroke( new BasicStroke( ticMajorWeight ) ); gtx.setColor( ticMajorColor ); for ( Line2D line : lineGen ) gtx.draw( line ); } } |
The next task will be to draw the labels. We’ll use two helper methods for this: drawHorizontalLabels and drawVerticalLabels. Before we get to those, however, let’s look at the final version (for this lesson) of paintComponent.
public void paintComponent( Graphics graphics )
{
    // begin boilerplate
    super.paintComponent( graphics );
    currWidth = getWidth();
    currHeight = getHeight();
    gtx = (Graphics2D)graphics;
    gtx.setColor( mwBGColor );
    gtx.fillRect( 0,  0, currWidth, currHeight );
    // end boilerplate

    // set up the label font
    //     round font size to nearest int
    int     fontSize    = (int)(labelFontSize + .5);
    labelFont = new Font( labelFontName, labelFontStyle, fontSize );
    gtx.setFont( labelFont );
    labelFRC = gtx.getFontRenderContext();

    // Describe the rectangle containing the grid
    float   gridWidth = currWidth - marginLeftWidth - marginRightWidth;
    float   minXco = marginLeftWidth;
    float   gridHeight = currHeight - marginTopWidth - marginBottomWidth;
    float   minYco = marginTopWidth;
    gridRect =
        new Rectangle2D.Float( minXco, minYco, gridWidth, gridHeight );

    drawGridLines();
    drawMinorTics();
    drawMajorTics();
    drawAxes();
    drawHorizontalLabels();
    drawVerticalLabels();
    paintMargins();
}
Drawing the Labels

Drawing the labels entails finding each major tick mark on the y-axis and vertically centering a label to the right of it. Likewise, we must find each major tick on the x-axis and center its label horizontally below it. As discussed in the Java Graphics Tools lesson, this requires finding the label’s bounding rectangle and correctly positioning its baseline. If you know something about font measurements, you might be aware that the descent (or descend) of the label might complicate this process, but numbers, +/- signs, and decimal points all live above the baseline, so we won’t have to worry about that. Also, the older, popular graphics facility for positioning text (based on the FontMetrics class) is flawed, so we’ll use the newer TextLayout facility.
The TextLayout Facility

To draw/measure text using the TextLayout facility, you need a Font, a Graphics2D, and a FontRenderContext. The Font and the FontRenderContext come from the Graphics2D. Once you have these three objects, you can get a TextLayout object. Then, you use the TextLayout object to obtain the bounding box of a label (TextLayout.getBounds()) and draw the text (TextLayout.draw(Graphics2D g, float x, float y)). The x and y arguments passed to the draw method are the coordinates of the text’s baseline (for more about the baseline, see the Java Graphics Tools lesson). I used the sample code below to draw the figure at the left. You can find it in the TextLayoutDemo class in the project sandbox.
1 2 3 4 5 6 7 8 9 10 11 12 13 14 15 16 17 18 19 20 21 22 23 24 25 26 27 28 29 30 31 32 33 34 35 36 37 38 39 40 41 42 43 44 45 46 47 48 49 50 51 52 53 | public void paintComponent( Graphics graphics ) { //////////////////////////////////// // Begin boilerplate //////////////////////////////////// super.paintComponent( graphics ); gtx = (Graphics2D)graphics; currWidth = getWidth(); currHeight = getHeight(); gtx.setColor( bgColor ); gtx.fillRect( 0, 0, currWidth, currHeight ); //////////////////////////////////// // End boiler plate //////////////////////////////////// gtx.setColor( Color.BLACK ); Font font = new Font( Font.MONOSPACED, Font.PLAIN, 25 ); gtx.setFont( font ); FontRenderContext frc = gtx.getFontRenderContext(); String label = "3.14159"; TextLayout layout = new TextLayout( label, font, frc ); Rectangle2D bounds = layout.getBounds(); float textXco = 50F; float textYco = 50F; layout.draw( gtx, textXco, textYco ); // The x- and y-coordinates of the bounding rectangle are screwy; // they're offsets from the baseline of the text. Rectangle2D rect = new Rectangle2D.Float( textXco + (float)bounds.getX(), textYco + (float)bounds.getY(), (float)bounds.getWidth(), (float)bounds.getHeight() ); gtx.draw( rect ); // Demonstrate that the bounding rectangle's x- and y-values // offsets from the test's baseline to the upper-left corner // of the bounding rectangle. double boundsXco = bounds.getX(); double boundsYco = bounds.getY(); int noteXco = (int)(textXco); int noteYco = (int)(textYco + 25); String fmt = "bounds x = %2.1f, bounds y = %2.1f"; String note = String.format( fmt, boundsXco, boundsYco ); Font noteFont = new Font( Font.SANS_SERIF, Font.PLAIN, 15 ); gtx.setFont( noteFont ); gtx.drawString( note, noteXco, noteYco ); } |
(About the above code: the x- and y- coordinates of the rectangle returned by getBounds are offsets from the baseline to the upper-left corner of the rectangle. The x-value is typically positive or 0, and the y-value is typically negative. We won’t be using these values in our code.)
Finding the Unit Value of a Tick Mark
We can determine the unit value of a tick mark on the x-axis by its distance from the y-axis, and the unit value of a tick mark on the y-axis by its distance from the x-axis. Suppose we have a grid unit of 400 and 10 major tick marks per unit. The spacing between tick marks will be 400 / 10 = 40 pixels. The second tick mark to the right of the y-axis will be drawn at a distance of 80 pixels from the origin; it will have a unit value of 80 (the distance to the mark) divided by 400 (pixels per unit), or 0.2.

Likewise, if we have a grid unit of 50 and 0.5 tick marks per unit, the spacing between tick marks will be 50 / 0.5 = 100 pixels. The first tick mark to the right of the y-axis will be drawn at a distance of 100 pixels from the origin; it will have a unit value of 100 (the distance to the mark) divided by 50 (pixels per unit), or 2.
Labels on the Y-Axis
We’ll use LineGenerator to return a sequence of lines corresponding to the major tic marks on the y-axis. Recall that part of the design is that the iterator for non-axial lines does not generate the lines x=0 or y=0. An annotated listing for the first part of this task, performed by drawHorizontalLabels, follows; see also Centering Text about a Line and Positioning Text.
1 2 3 4 5 6 7 8 9 10 11 12 13 14 15 16 17 18 19 20 21 22 23 24 25 | /** * Draw the labels on the horizontal tic marks * (top to bottom of y-axis). */ private void drawHorizontalLabels() { // padding between tic mark and label final int labelPadding = 3; LineGenerator lineGen = new LineGenerator( gridRect, gridUnit, ticMajorMPU, ticMajorLen, LineGenerator.HORIZONTAL ); float spacing = gridUnit / ticMajorMPU; float labelIncr = 1 / ticMajorMPU; float originYco = (float)gridRect.getCenterY(); for ( Line2D line : lineGen ) { // ... } } |
- Line 8: This is the padding to insert between a tic mark and its label.
- Lines 10-17: Create a generator for horizontal lines, specifying the number of tics per unit (ticMajorMPU) and the length of a major tic (ticMajorLen).
- Line 18: Calculate the number of pixels between each tic mark.
- Line 19: Calculate the number of units a major tick mark represents. For example, if there are 2 ticks per unit, this will be 0.5; if there are 0.5 ticks per unit, this will be 2.
- Line 20: Get the y-coordinate for the y-axis.
- Line 21: Iterate over the list of lines (see below).
Inside the loop, for each line, we have to calculate the x- and y-coordinates of the label’s baseline and the unit value of the tic mark (e.g., .5, 1, 1.5, etc.). As shown above, we can find the unit value of a tick mark from the GPU and the distance between the tick mark and the origin. The x-coordinate of the label is the x-coordinate of the right end of the tic mark + the label padding. The y-coordinate is the tic mark’s y-coordinate plus half the height of the label’s bounding rectangle (see Centering Text about a Line). To get the bounding rectangle and draw the label, we will need the current Font and the FontRenderContext; recall that we obtain these each time the Java runtime invokes the paintComponent method:
int     fontSize    = (int)(labelFontSize + .5);
labelFont = new Font( labelFontName, labelFontStyle, fontSize );
gtx.setFont( labelFont );
labelFRC = gtx.getFontRenderContext();
At the bottom of the loop, we calculate the value of the next label to draw. Here’s an annotated listing of the loop.
1 2 3 4 5 6 7 8 9 10 11 12 13 14 15 | for ( Line2D line : lineGen ) { float xco2 = (float)line.getX2(); float yco1 = (float)line.getY1(); int dist = (int)((originYco - yco1) / spacing); float next = dist * labelIncr; String label = String.format( "%3.2f", next ); TextLayout layout = new TextLayout( label, labelFont, labelFRC ); Rectangle2D bounds = layout.getBounds(); float yOffset = (float)(bounds.getHeight() / 2); float xco = xco2 + labelPadding; float yco = yco1 + yOffset; layout.draw( gtx, xco, yco ); } |
- Line 3: Get the x-coordinate of the right-hand end of the tic mark.
- Line 4: Get the y-coordinate of the tic mark.
- Line 5: Get the distance, in tic marks, between the origin and the tic mark we are labeling. The figure (originYco – yco1) is the distance in pixels; note that if the tic mark is above the origin, this is a positive value, and if the tic mark is below the origin, it’s a negative value. Dividing by the spacing between tic marks gives us the distance in tic marks.
- Line 6: Calculate the unit value of the tic mark.
- Line 7: Format the unit value as a string with two digits past the decimal point.
- Lines 8-10: Get a TextLayout object that encapsulates the label, and obtain the label’s bounding rectangle.
- Line 11: Calculate the y-offset that will center the label with respect to the horizontal tic mark to its left.
- Line 12: Calculate the label’s x-coordinate, which is slightly to the right of the tic mark.
- Line 13: Calculate the y-coordinate of the label’s baseline, which is the y-coordinate of the tic mark adjusted by one-half the height of the label’s bounding box.
- Line 14: Draw the label.
Labels on the X-Axis
Drawing the labels on the vertical tic marks (on the x-axis) is similar. The main difference is that the y-coordinate of the label’s baseline will be the y-coordinate of the lower end of the tic mark plus the height of the label’s bounding rectangle plus padding. The x-coordinate is the x-coordinate of the tic mark minus half the width of the bounding rectangle. The code follows below.
Note: the student is encouraged to attempt to write this method before viewing the provided solution.
1 2 3 4 5 6 7 8 9 10 11 12 13 14 15 16 17 18 19 20 21 22 23 24 25 26 27 28 29 30 31 32 33 34 | private void drawVerticalLabels() { // padding between tic mark and label final int labelPadding = 3; LineGenerator lineGen = new LineGenerator( gridRect, gridUnit, ticMajorMPU, ticMajorLen, LineGenerator.VERTICAL ); float spacing = gridUnit / ticMajorMPU; float labelIncr = 1 / ticMajorMPU; float originXco = (float)gridRect.getCenterX(); for ( Line2D line : lineGen ) { float xco1 = (float)line.getX2(); int dist = (int)((xco1 - originXco) / spacing); float next = dist * labelIncr; String label = String.format( "%3.2f", next ); TextLayout layout = new TextLayout( label, labelFont, labelFRC ); Rectangle2D bounds = layout.getBounds(); float yOffset = (float)(bounds.getHeight() + labelPadding); float xOffset = (float)(bounds.getWidth() / 2); float xco = xco1 - xOffset; float yco = (float)line.getY2() + yOffset; layout.draw( gtx, xco, yco ); } } |
Short of plotting a curve, that’s the code for displaying our Cartesian plane. In our lessons, we have much to do before we get to plotting, including documentation, testing, and property management. I understand, however, if you’re chomping at the bit and are ready for some visual results. If so, I encourage you to add some simple plotting code to CartesianPlane and a main method that plots a simple curve. I have done so in the GitHub repository in the classes CartesianPlaneTemp and MainTemp in the project sandbox.
Summary
This lesson focused on developing the LineGenerator class, a facility for iterating a sequence of lines that we will use to assemble the CartesianPlane grid. We also looked at Java’s TextLayout facility, and used it in conjunction with LineGenerator to paint labels on the grid’s major tick marks. In the next lesson, we’ll discuss documentation, specifically the Javadoc facility for writing documentation in-line with your code.